
If a slow site is making you consider a rebuild, here is what that actually costs in Bhubaneswar.
We Tested 50 Bhubaneswar Business Websites for Speed: The Results Are Bad [2026]
Date: 15 - 10 - 2026
Time to read: 17 minutes
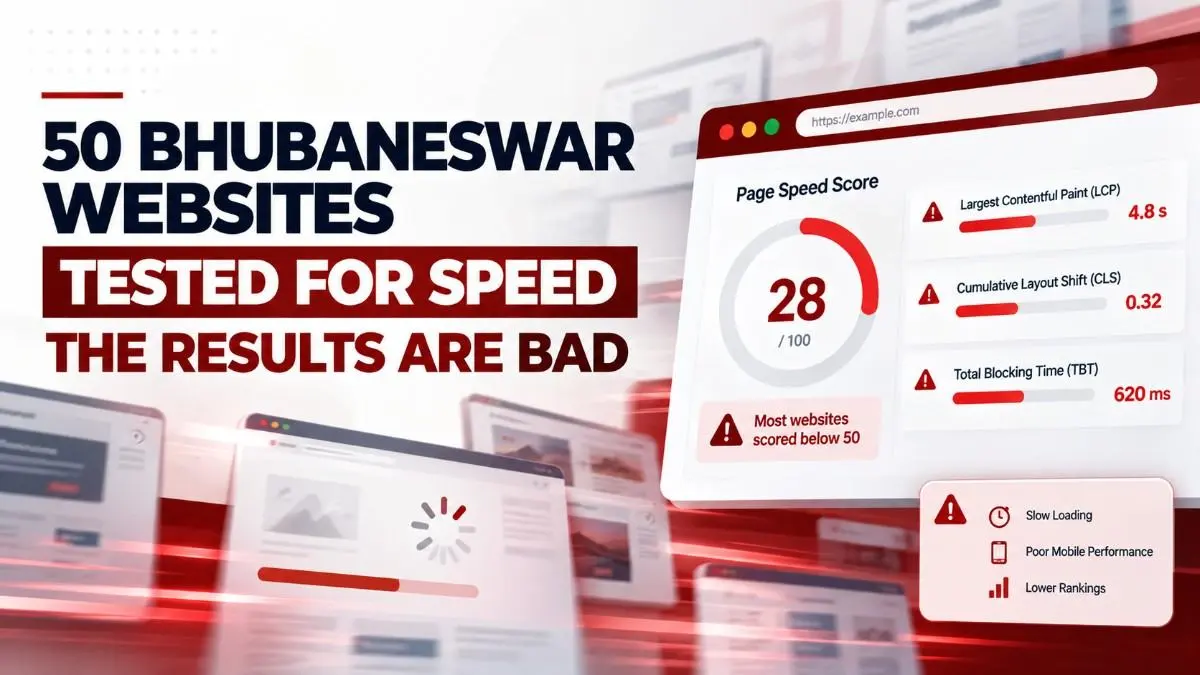
Key Takeaways
- In Oddtusk's audit of 50 Bhubaneswar business websites, 34 scored below 50 on Google's mobile PageSpeed test, which Google classifies as poor.
- The median mobile Largest Contentful Paint across the 50 sites was 6.8 seconds, nearly three times Google's 2.5 second good threshold.
- Twenty-two of the 50 sites had a Cumulative Layout Shift score above 0.25, the threshold Google defines as poor.
- Unoptimized JPEG and PNG images, instead of WebP or AVIF, were the single most common problem, found on 41 of the 50 sites.
- Only 12 of the 50 sites used lazy loading, and the average mobile homepage weighed 4.8 megabytes, with the heaviest reaching 18.4 megabytes.
- All five sites that scored 90 or above on mobile PageSpeed ranked on page one for at least one local search query Oddtusk checked.
[ Table of Content ]
We ran a website speed test on 50 real Bhubaneswar business websites, using Google PageSpeed Insights and Lighthouse, and the results were worse than we expected. Clinics, law firms, coaching institutes, real estate agencies, restaurants, logistics companies, ecommerce stores, and IT service providers: all live sites, all presumably doing the job of representing a real business online.
Most of them are losing traffic, rankings, and customers today because of speed and Core Web Vitals problems that are well within reach to diagnose and fix. This article is that audit: the methodology, the full numbers, and what we think it means for any Bhubaneswar business trying to rank locally.
A note from our founder
We run a version of this audit on every new client's site before we touch anything else, because speed problems hide in plain sight until someone actually measures them. We decided to run it at scale across Bhubaneswar and publish the numbers, because nobody had, and because the pattern we see client after client is worth more as data than as an anecdote.
Sanjay Ananda, Founder and CEO, OddtuskWhy We Tested 50 Bhubaneswar Business Websites for Speed
No Bhubaneswar-specific website speed test data existed before this audit. National averages and global benchmarks from Google and Cloudflare exist, but nobody had looked specifically at what the web performance picture looks like for Bhubaneswar businesses themselves.
That gap matters because the context here is genuinely different. Most of Bhubaneswar's web traffic arrives over mobile networks that vary widely in quality across the city, and the device mix leans heavily toward mid-range Android phones rather than high-end devices, which changes how a page actually renders and parses in the real world.
Why this matters for rankings
Core Web Vitals are the metrics Google uses to measure page experience, and Google has confirmed that page experience is one of its ranking signals. A site with a poor Largest Contentful Paint, Cumulative Layout Shift, or Interaction to Next Paint score is working against itself in search, no matter how strong its content or backlinks are.
We did not ask the businesses in this sample for permission, because every site tested is a publicly accessible URL and this audit reports on patterns across the sample rather than naming or evaluating any individual business.
Methodology: How We Tested 50 Bhubaneswar Websites
A website speed test is only meaningful if the test conditions are consistent, so we selected 50 businesses with a registered presence in Bhubaneswar, spanning eleven categories, and ran every site through the same process.
| Methodology step | Detail |
|---|---|
| Sample | 50 Bhubaneswar business websites across healthcare and clinics, education, real estate, legal and financial services, restaurants and hospitality, ecommerce and retail, logistics, IT and digital services, and other professional services |
| Primary tool | Google PageSpeed Insights, tested in a standardised environment |
| Test runs | Three runs per site in both mobile and desktop mode; the median score across the three runs was used |
| Lighthouse audit | Run on each site's homepage to capture LCP, CLS, INP, Time to First Byte, and total page weight |
| Date | October 2026 |
The Overall Picture: Core Web Vitals Scores in Bhubaneswar
Across the 50 sites we tested, the average mobile PageSpeed Insights score was 32 out of 100, and most of the sample exposes a general lack of any website performance budget at all.
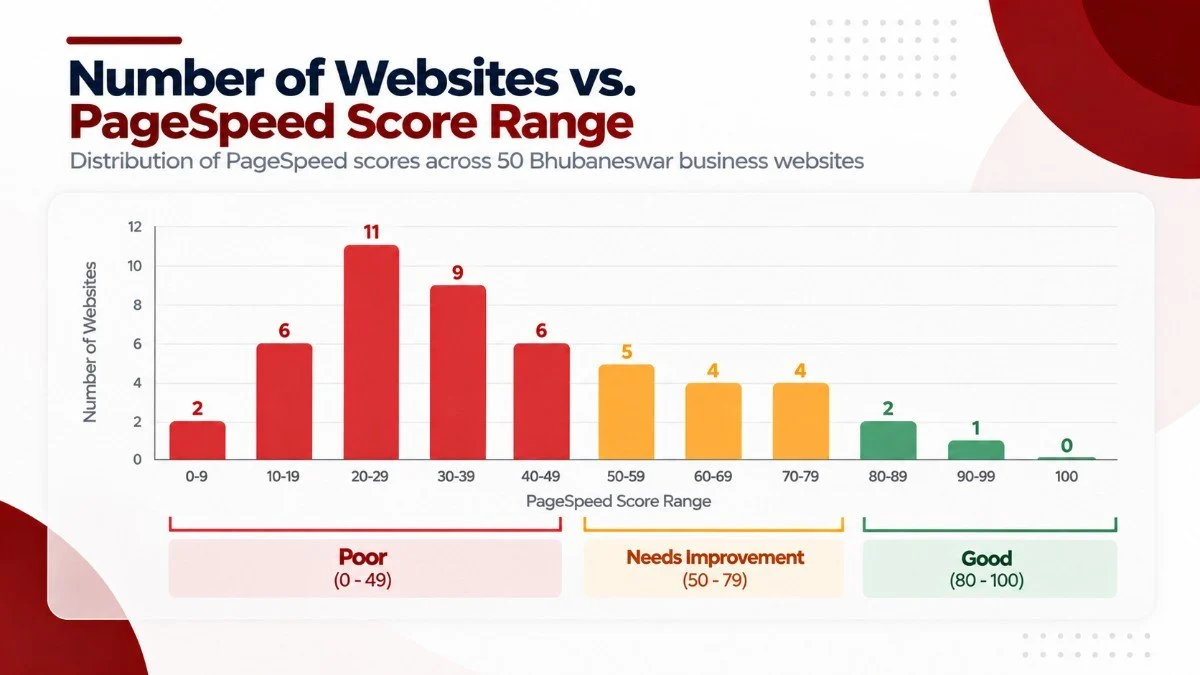
| Mobile PageSpeed score band | Google's rating | Sites in this band |
|---|---|---|
| 0 to 49 | Poor | 34 of 50 |
| 50 to 89 | Needs improvement | 11 of 50 |
| 90 to 100 | Good | 5 of 50 |
Why Mobile Scores Matter More Than Desktop
Twenty-one of the fifty sites scored above 90 on desktop, but desktop performance is close to irrelevant for most Bhubaneswar businesses, since the large majority of real local search traffic arrives on mobile.
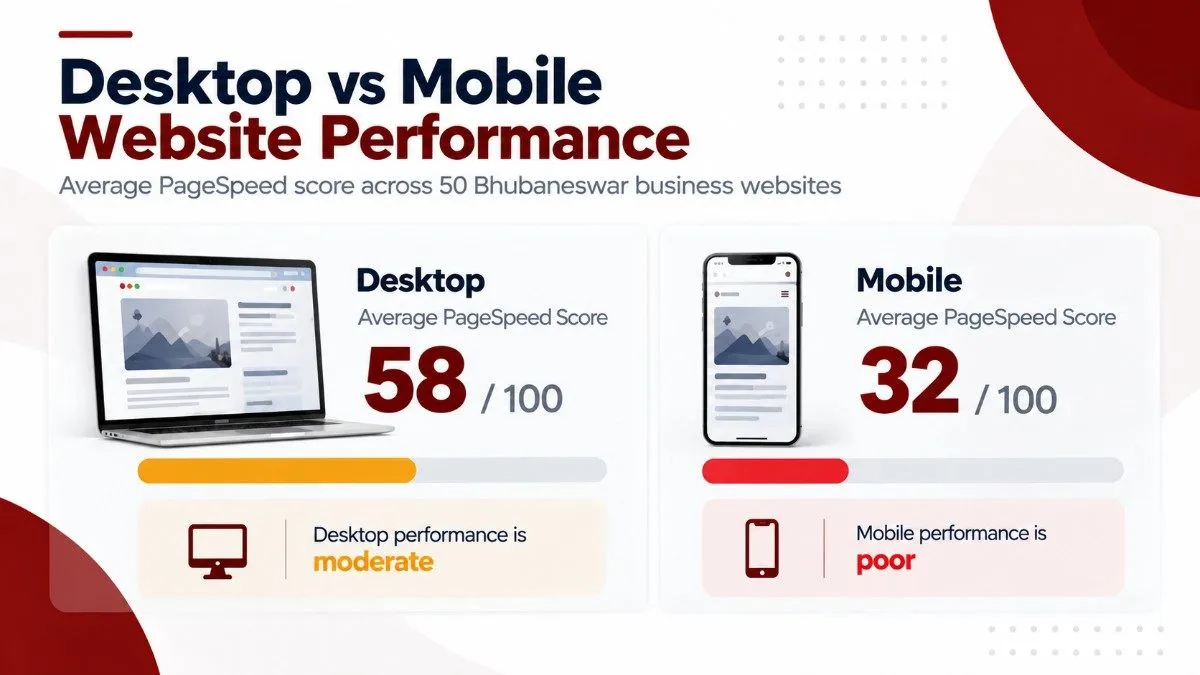
58 vs 32
Average desktop PageSpeed score across the sample, compared with an average mobile score of 32. Because Google indexes and ranks pages primarily using the mobile version of the page, a site scoring 82 on desktop and 28 on mobile is ranked using the 28, not the 82.
Google moved to mobile-first indexing specifically because most searches now happen on a phone, and a website that performs well on desktop but poorly on mobile is doing poorly by the customer actually trying to reach it.
LCP, CLS, and INP: The Three Core Web Vitals, Broken Down
Core Web Vitals are, specifically, three metrics: Largest Contentful Paint, Cumulative Layout Shift, and Interaction to Next Paint. Every site in our sample fell short of at least one of them on mobile.
Largest Contentful Paint (LCP): How Long Before the Page Becomes Useful
LCP tracks the time from when a user opens a page to when the largest visible element, typically a hero image or headline, is fully loaded. Google rates an LCP of 2.5 seconds or less as good, and anything above 4 seconds as poor.
| LCP metric | Value |
|---|---|
| Median mobile LCP, across 50 sites | 6.8 seconds |
| Fastest site recorded | 1.4 seconds |
| Slowest site recorded | 18.2 seconds |
| Sites with LCP above 10 seconds | 11 of 50 |
The most common cause of a slow LCP was a large, unoptimized hero image, a problem concentrated in real estate and hospitality sites, where a full-width property photo weighing several megabytes will produce a slow LCP regardless of any other fix made on the page.
Cumulative Layout Shift (CLS): Pages That Jump While You're Trying to Use Them
CLS measures how much a layout moves around while a page is still loading, the moment a user tries to tap a button but the button jumps because a banner further down the page has just loaded. Google rates a CLS below 0.1 as good and anything above 0.25 as poor.
| CLS metric | Value |
|---|---|
| Sites with mobile CLS above 0.25 | 22 of 50 |
| Sites with CLS above 1.0 | 8 of 50 |
| Worst CLS recorded | 2.4, roughly two and a half screen heights of shift during a typical load |
What causes bad CLS, based on this sample
- Images and iframes loading with no defined width and height, forcing a reflow once they finish loading
- Content injected into the page after it loads, such as a banner or a chat widget popping in without reserved space
For a clinic site where a visitor is trying to find a phone number, or an ecommerce site where they're trying to add a product to a cart, this kind of layout instability directly costs conversions, not just a worse score on a report.
Interaction to Next Paint (INP): Whether the Site Actually Responds
INP measures the delay between a user's tap or click and the moment the browser visibly responds to it. INP became a stable Core Web Vital in 2024, replacing First Input Delay. Google rates an INP under 200 milliseconds as good and anything above 500 milliseconds as poor.
| INP metric | Value |
|---|---|
| Sites with mobile INP in the poor range | 19 of 50 |
| Median INP across the sample | 340 milliseconds (needs improvement) |
| Worst INP recorded | 1,180 milliseconds |
High INP happens when JavaScript blocks the browser's main thread. Across the sites we tested, the leading causes were third-party chat widgets loading synchronously, heavy page-builder scripts, and analytics tags that were never set to load asynchronously. None of these are server problems; they are code and script-loading choices that get fixed with script management, not a hosting upgrade.
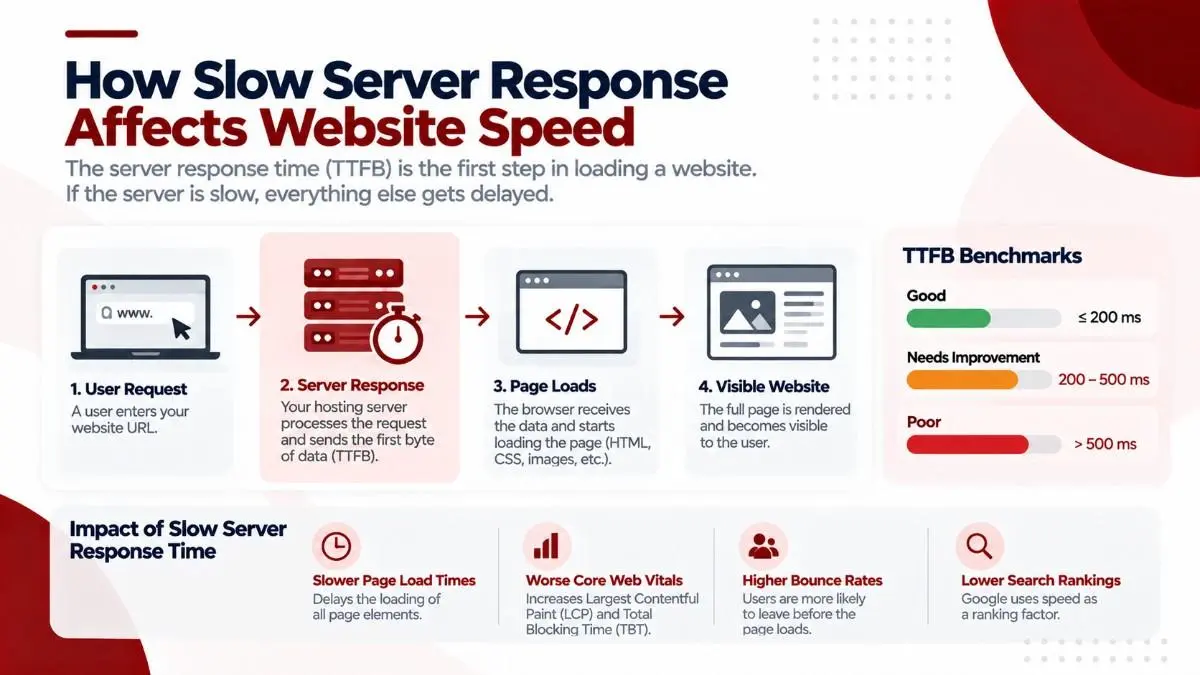
Time to First Byte: The Floor Under Everything Else
A technical note
Time to First Byte is not one of Google's three official Core Web Vitals. It is listed separately, as a supporting diagnostic metric that helps explain a slow LCP (web.dev, see Sources). We cover it here because, in this sample, it was consistently the issue that made every other fix matter less.
TTFB is the time between a browser requesting a page and the server sending back the first byte of a response. It is the practical floor under every other metric on this list: no amount of image optimization or JavaScript cleanup can overcome a server that takes four seconds to respond. A good TTFB is under 800 milliseconds; a poor one is above 1,800 milliseconds.
| TTFB metric | Value |
|---|---|
| Median TTFB across 50 sites | 1,240 milliseconds |
| Sites with TTFB above 1,800 milliseconds | 17 of 50 |
| Slowest site recorded | 4.2 seconds, before any content had loaded |
Slow TTFB was concentrated among businesses whose sites still sit on inexpensive shared hosting with no caching layer, usually a plan the original agency selected at launch and that nobody has revisited since. A site built in 2019 on a shared host costing a few thousand rupees a year is, in our experience, almost always still on that same host, because nobody is tracking TTFB or connecting it back to the hosting decision.
Hosting is an ongoing cost decision, not a one-time one, in the same way maintenance is; our ecommerce website maintenance cost guide covers what reasonable hosting and upkeep should actually cost once a site is live.
Image Optimization: The Most Common, Most Fixable Problem
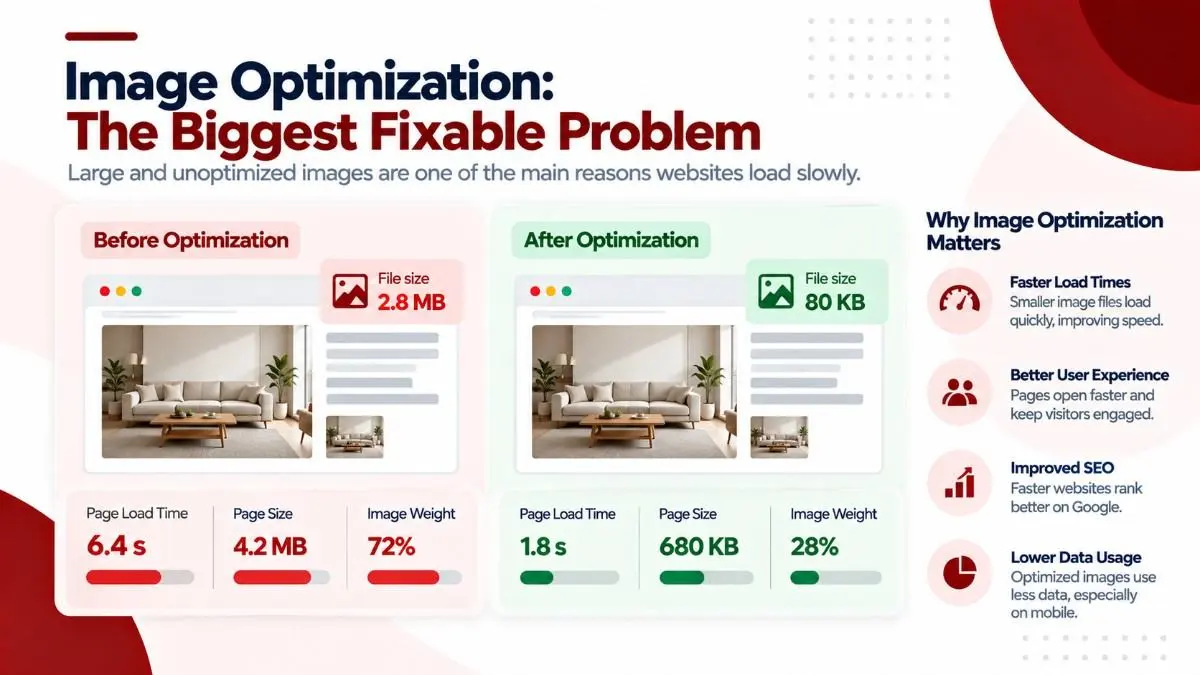
Of everything we measured, image delivery was the single most common failure across the 50 sites, and it is also the easiest of the findings in this audit to fix without a redesign.
| Finding | Sites affected |
|---|---|
| Images delivered as JPEG or PNG, not WebP or AVIF | 41 of 50 |
| Images delivered at pixel dimensions far larger than the display size | 36 of 50 |
| Sites using lazy loading correctly | 12 of 50 (the other 38 loaded all images immediately) |
WebP and AVIF are supported by every modern browser and typically cut image file size by 30 to 50 percent with no visible quality loss, and image format conversion is a standard, often automatic feature in most modern content management systems. Oversized dimensions are the other half of the problem: a 3,000 by 2,000 pixel photo displayed in a 400-pixel mobile column still gets downloaded at full resolution and scaled down in the browser, which wastes bandwidth and adds load time for no visual benefit.
4.8 MB
Average mobile homepage weight across the 50 sites. The lightest homepage measured 640 KB; the heaviest measured 18.4 MB, which is not a realistic homepage for most Bhubaneswar mobile users on an inconsistent connection.
Ecommerce sites carrying a large product catalog face a related but slightly different version of this problem. Our own Shopify website speed optimization guide covers the platform-specific fixes for that case in more depth than this audit does.
The Real Root Cause: Three Compounding Problems, Not One
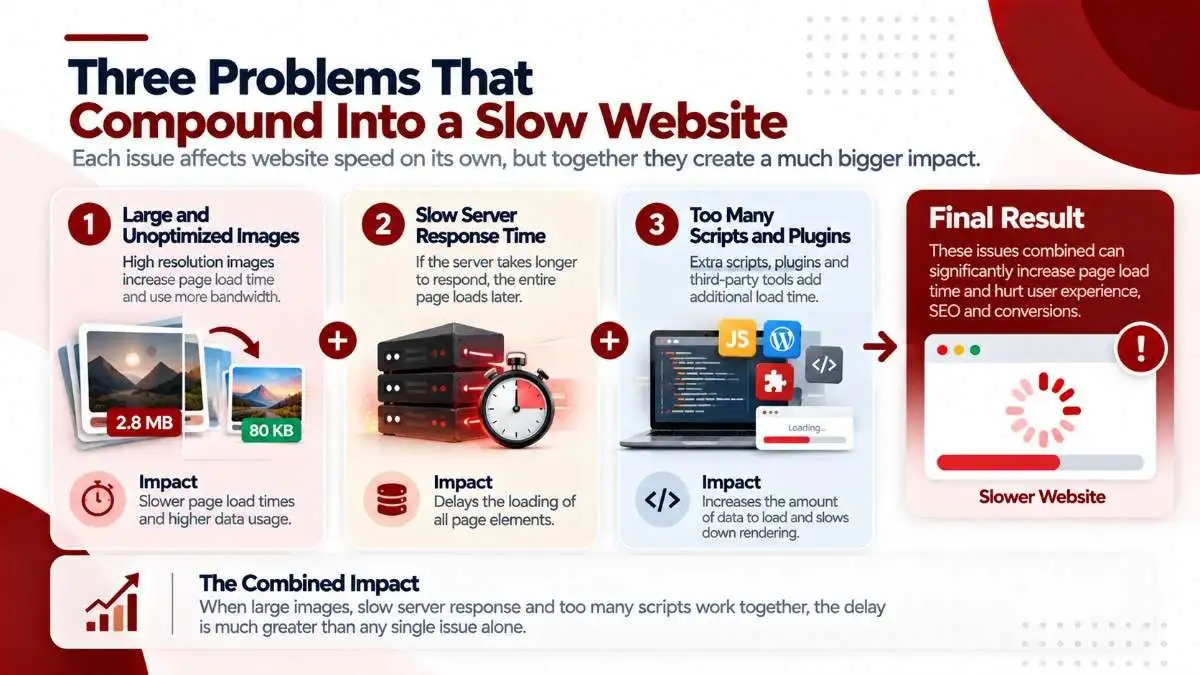
Across all 50 sites, the biggest single weakness was never one isolated metric; it was a combination of unoptimized images, missing lazy loading, and slow server response showing up together on the same site.
The pattern we actually found
- Image optimization. Present on 41 of 50 sites as a problem, and the single most common finding in the audit.
- Lazy loading. Missing on 38 of 50 sites, compounding the image-weight problem instead of offsetting it.
- Hosting quality. Behind the slow TTFB on 17 of 50 sites, and the one problem that no amount of frontend work can fix on its own.
These are not mysterious or unusual technical problems; they are well documented and familiar to any developer working in 2026. That the same three problems recur across most of the sites we tested suggests these sites were built at a time when performance was not a design consideration, and have never been revisited with performance in mind since launch.
What This Means for Local Search Rankings
Businesses in Bhubaneswar compete for the same local search queries, such as "clinic near me," "real estate agent Bhubaneswar," or "coaching institute BBSR," and page speed is one of the few differentiators Google can measure directly when several competing pages otherwise look similar.
Not every business ranking on page one for those queries is there because it offers the best service or has the most experience. In crowded local-search categories, where several businesses offer comparable content and similar domain strength, a measurable page-experience signal becomes one of the few remaining tiebreakers.
Page speed is only one input into that competition, though. If your Core Web Vitals are already solid and you're still not showing up for local searches, the gap is usually elsewhere, and our SEO cost in Bhubaneswar pricing guide covers what that separate piece of work typically involves.
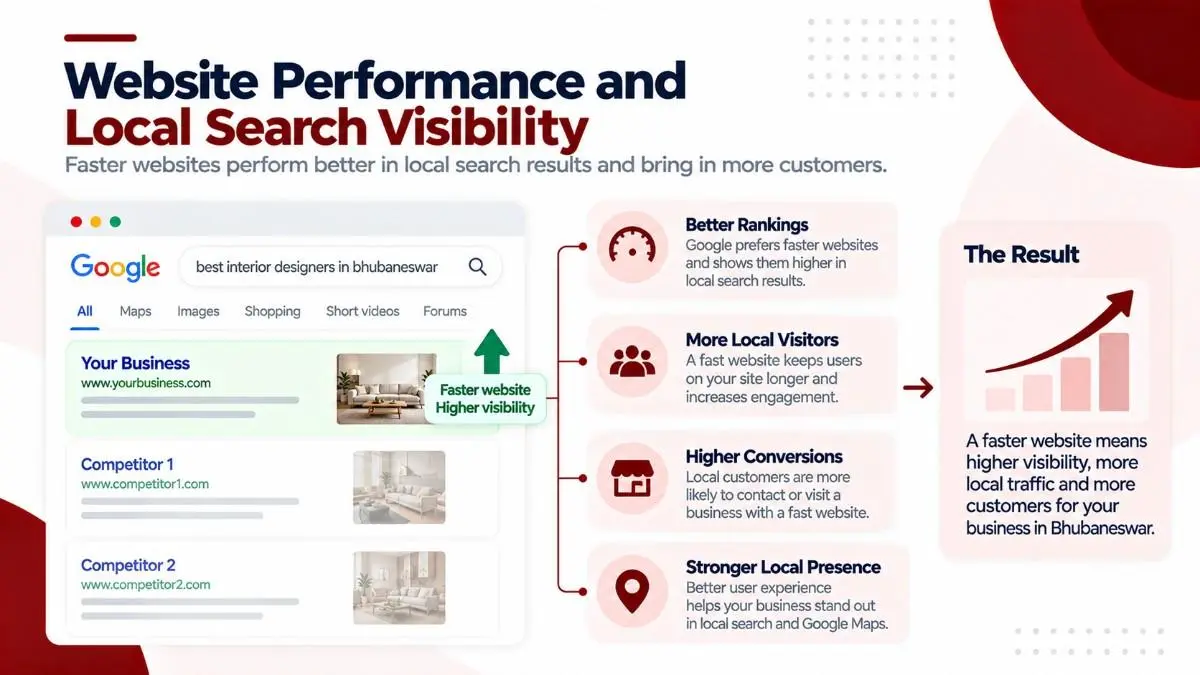
5 of 5
Every site in our sample that scored 90 or above on mobile PageSpeed also ranked on page one for at least one local query we checked. That is a small sample, so it is a correlation worth noting rather than proof of a direct cause, but it is consistent with what Google has stated publicly about page experience as a ranking signal.
How to Check Your Own Site's Core Web Vitals for Free
You do not need this audit's tooling to find out where your own site stands; the same tools we used are free and give the same numbers Google itself relies on.
| Tool | What it tells you |
|---|---|
| Google PageSpeed Insights | Real-user Core Web Vitals data plus a Lighthouse lab test, for both mobile and desktop |
| Core Web Vitals report in Google Search Console | How Google is actually scoring your indexed pages over time, using real visitor data |
| Lighthouse audit (Chrome DevTools) | A detailed, page-by-page breakdown with specific fix recommendations |
| GTmetrix | A third-party lab test, useful for deeper waterfall-level debugging once you already know a page is slow |
Conclusion
At Oddtusk, a version of this audit is part of our baseline diagnostic process for every new client. What we consistently find in Bhubaneswar matches what this larger sample confirms: sites built without performance as a consideration, hosting chosen for cost rather than speed, images that were never optimized, and scripts that were never audited after launch.
We treat website performance as the same thing as rankings and revenue, not a separate technical concern. A slow website ranks lower, loses visitors faster, and converts at a lower rate than a fast one, and every fix to LCP, CLS, or INP compounds into better commercial performance over time. If you run a business in Bhubaneswar and have not checked your Core Web Vitals in Google Search Console recently, this data suggests there is a real chance your site falls in the poor tier on at least one of these metrics.
If the honest answer for your site is a rebuild rather than a fix, our website design cost in Bhubaneswar guide breaks down what that actually costs before you talk to an agency.
How Oddtusk Approaches Website Performance
We build performance in from the first line of code rather than retrofitting it after launch, which is a different approach from most of what this audit found across the sample.
What this looks like in practice
- No unnecessary script weight. When we built Master Power Group's 21-page corporate website as fully custom-coded HTML with no CMS underneath it, that choice also meant no page-builder bloat and no plugin stack competing for the main thread, the same category of problem behind the worst INP scores in this audit.
- Image optimization by default. WebP delivery and correctly sized images ship at launch, not as a follow-on project once someone notices the site is slow.
- Hosting matched to the project. We choose hosting and caching based on what the site actually needs, not the cheapest plan available at signup.
- Lazy loading as standard. Offscreen images defer by default in every build we deliver.
As a web design company in Bhubaneswar, we see the same handful of root causes repeat across almost every speed audit we run for a new client. If you would like your own site's Core Web Vitals reviewed as part of a proper website performance audit, talk to our team and we will tell you plainly what is actually slowing the site down.
Want to know where your own site stands?
Send us your URL and we'll run the same Core Web Vitals checks used in this audit, free, with no strings attached.
Get a Free Speed Check
[ Common questions ]
Frequently Asked Questions
In Oddtusk's audit of 50 Bhubaneswar business websites, the three most common causes were unoptimized images (41 of 50 sites), missing lazy loading (38 of 50 sites), and slow server response from cheap shared hosting with no caching layer. These three problems usually compound rather than appear in isolation, which is why a single fix rarely solves a slow-loading site on its own.
Yes. Google has confirmed that Core Web Vitals and page experience are a ranking signal, and in our audit, all five sites that scored 90 or above on mobile PageSpeed ranked on page one for at least one local search query we checked. That is a small sample and not proof of a direct cause, but it lines up with what Google has stated publicly about page experience; speed is one input into rankings, and our SEO cost in Bhubaneswar pricing guide covers the rest of what goes into ranking locally.
Yes, specifically through Core Web Vitals, which Google has included as part of its page experience ranking signals since 2021. It matters most in competitive local searches, where several businesses offer comparable content and similar domain strength, since performance becomes one of the few remaining differentiators.
Google rates Largest Contentful Paint (LCP) as good at 2.5 seconds or less, Cumulative Layout Shift (CLS) as good at 0.1 or less, and Interaction to Next Paint (INP) as good at 200 milliseconds or less. In our Bhubaneswar sample, the median site missed all three of these good thresholds on mobile.
This happens because most websites are still designed and tested on a desktop screen with a fast office or home connection, while real visitors load the site on a mid-range phone over a mobile network. In our audit, the average desktop PageSpeed score was 58 while the average mobile score was 32, and since Google ranks pages primarily on their mobile version, the lower mobile score is the one that actually counts, a pattern explained in more detail by Google's own mobile-first indexing announcement.
Google PageSpeed Insights and the Core Web Vitals report inside Google Search Console are both free and use real Google data. Running a Lighthouse audit directly from Chrome DevTools is another free option that gives the same LCP, CLS, and INP numbers along with specific fix recommendations.
The most common cause, found across our sample, is images and iframes loading without a defined width and height, which forces the browser to shift the layout once they finish loading. Content that gets injected into the page after it loads, such as a banner or a chat widget popping in, is the other major cause.
Google PageSpeed Insights reports Google's own real-user Core Web Vitals data alongside a Lighthouse lab test, which is the data Google actually uses for ranking. GTmetrix is a third-party tool that runs its own lab tests and is useful for deeper waterfall-level debugging, but the Core Web Vitals numbers that matter for search rankings come from Google's own tools.
Sources
- Google, web.dev (2024). Web Vitals.
- Google Chrome Developers. How Lighthouse calculates your overall Performance score.
- Google Search Central (2020). Evaluating page experience for a better web.
- Google Search Central (2018). Rolling out mobile-first indexing.
- Oddtusk, Google PageSpeed Insights and Lighthouse audit data collected across 50 Bhubaneswar business websites, October 2026.
- Oddtusk project records, Master Power Group website redesign and development engagement (Nairobi), September 2026.

About the author
Sanjay Ananda
Founder and CEO, Oddtusk
Sanjay Ananda founded Oddtusk in Bhubaneswar and leads its website design, SEO, AEO, and growth engineering work for businesses across India, the US, and the UK, including the performance audits and custom-coded builds described in this article.
